E-Submission
Indexed in: ESCI, Scopus, PubMed,
PubMed Central, CAS, DOAJ, KCI
PubMed Central, CAS, DOAJ, KCI
FREE article processing charge

Articles
- Page Path
- HOME > J Yeungnam Med Sci > Volume 36(3); 2019 > Article
-
Original article
Assessment of solid components of borderline ovarian tumor and stage I carcinoma: added value of combined diffusion- and perfusion-weighted magnetic resonance imaging -
See Hyung Kim

-
Yeungnam University Journal of Medicine 2019;36(3):231-240.
DOI: https://doi.org/10.12701/yujm.2019.00234
Published online: June 13, 2019
Department of Radiology, School of Medicine, Kyungpook National University, Daegu, Korea
- Corresponding author: See Hyung Kim, Department of Radiology, School of Medicine, Kyungpook National University, 130, Dongdeok-ro, Jung-gu, Daegu 41944, Korea Tel: +82-53-200-5390, Fax: +82-53-422-2677, E-mail: kimseehyung72@outlook.kr
• Received: May 8, 2019 • Revised: June 4, 2019 • Accepted: June 6, 2019
Copyright © 2019 Yeungnam University College of Medicine
This is an Open Access article distributed under the terms of the Creative Commons Attribution Non-Commercial License (http://creativecommons.org/licenses/by-nc/4.0/) which permits unrestricted non-commercial use, distribution, and reproduction in any medium, provided the original work is properly cited.
- 8,188 Views
- 83 Download
- 3 Crossref
This article has been corrected. See "Erratum to “Assessment of solid components of borderline ovarian tumor and stage I carcinoma: added value of combined diffusion- and perfusion-weighted magnetic resonance imaging”" in Volume 37 on page 147.
Abstract
-
Background
- We sought to determine the value of combining diffusion-weighted (DW) and perfusion-weighted (PW) sequences with a conventional magnetic resonance (MR) sequence to assess solid components of borderline ovarian tumors (BOTs) and stage I carcinomas.
-
Methods
- Conventional, DW, and PW sequences in the tumor imaging studies of 70 patients (BOTs, n=38; stage I carcinomas, n=32) who underwent surgery with pathologic correlation were assessed. Two independent radiologists calculated the parameters apparent diffusion coefficient (ADC), Ktrans (vessel permeability), and Ve (cell density) for the solid components. The distribution on conventional MR sequence and mean, standard deviation, and 95% confidence interval of each DW and PW parameter were calculated. The inter-observer agreement among the two radiologists was assessed. Area under the receiver operating characteristic curve (AUC) and multivariate logistic regression were performed to compare the effectiveness of DW and PW sequences for average values and to characterize the diagnostic performance of combined DW and PW sequences.
-
Results
- There were excellent agreements for DW and PW parameters between radiologists. The distributions of ADC, Ktrans, and Ve values were significantly different between BOTs and stage I carcinomas, yielding AUCs of 0.58 and 0.68, 0.78 and 0.82, and 0.70 and 0.72, respectively, with ADC yielding the lowest diagnostic performance. The AUCs of the DW, PW, and combined PW and DW sequences were 0.71±0.05, 0.80±0.05, and 0.85±0.05, respectively.
-
Conclusion
- Combining PW and DW sequences to a conventional sequence potentially improves the diagnostic accuracy in the differentiation of BOTs and stage I carcinomas.
- The presence of solid components in ovarian tumors strongly suggests carcinoma, but solid components can also be seen in borderline ovarian tumors (BOTs). BOTs are a class of epithelial tumors; histologically, they show atypical nuclei without cell proliferation and epileptic involvement. Resection is considered to be sufficient treatment for BOTs; adjuvant chemotherapy after surgery has no significant correlation with the recurrence rate. BOTs have been shown to have a low recurrence rate and a high survival rate [1-5].
- The preoperative diagnosis of BOTs and stage I carcinomas remains difficult, despite the development of various imaging techniques. Ultrasonography is generally used to assess ovarian tumors, but its accuracy is not high because of the overlapping features of different tumor types. Magnetic resonance imaging (MRI) is superior to ultrasound or computed tomography in the evaluation of tissue components and easily identifies solid components. Therefore, MRI is often used to diagnose ovarian cancers, focusing on detection of solid areas, among other features, in distinguishing tumor types. However, even with conventional MRI, it is difficult to distinguish between BOTs with solid components and primary carcinomas [5-7].
- Recent advances in MRI have improved the preoperative diagnosis of ovarian tumors. The usefulness of diffusion-weighted (DW) and perfusion-weighted (PW) sequences has been reported in several studies; these imaging sequences have been used to assess the density of tumor cells and evaluate neovasculature and microvasculature [7-9]. Solid components in BOTs and stage I carcinomas are characterized by high signal intensity, reflecting long tumor relaxation time with prolonged T2 relaxation time on DW images, and early dynamic enhancement reflecting tumor angiogenesis associated with microvessel densities [9-12]. It has already been shown that combining DW or PW imaging with a conventional magnetic resonance (MR) sequence is effective in discriminating benign and malignant ovarian tumors [11-13]. However, no reports have been published to date that demonstrate the contribution of DW and PW sequences to the differential diagnosis of BOTs and stage I carcinomas. Therefore, the purpose of this study is to assess the combination of PW and DW sequences with a conventional MR sequence to potentially improve diagnostic accuracy in the differentiation of BOTs and stage I carcinomas.
Introduction
- This study was approved by the Kyungpook National University Hospital Institutional Review Board (Approval No. S-201221) with waiver of informed consent. We reviewed the medical records dating from December 2015 to May 2017 of 118 patients with BOTs or stage I carcinomas treated in our institution. Of these patients, 70 with solid tumors on MRI were included (BOTs, 38 patients; stage I carcinomas, 32 patients). All tumor diagnoses were confirmed histopathologically. MRI, including conventional, DW, and PW sequences, was performed in 57 of the 70 patients. DW sequences were excluded in 7 patients (T1-weighted high-intensity mass, 3 patients; artifact shadow, 4 patients), and 9 patients (contrasted myometrial defects, 4 patients; technical problems such as artificial shadowing, 5 patients). Table 1 summarizes the results of the exponential test in the patient groups that underwent imaging with DW and PW sequences in combination with conventional MRI. Of the patients with tumors identified as BOTs, 12 had mucinous tumors and 26 had serous tumors, whereas 11 of the patients with stage I carcinoma had mucinous tumors and 21 had serous tumors. The ages of the patients with BOTs ranged from 19 to 62 years (mean, 40.8±14.2 years). The ages of the patients with stage I carcinoma ranged from 25 to 71 years (mean, 43.2±13.2 years). Thirteen patients had undergone unilateral or bilateral salpingo-oophorectomy (BSO) due to clinical conditions such as fertility problems. The remaining patients had undergone hysterectomy, BSO, and lymphadenectomy for a clinical diagnosis of carcinoma.
- MRI was performed with a 1.5-T scanner (Avanto; Siemens, Erlangen, Germany) using a pelvic phased array coil. Patients were given 1 mg of glucagon into the muscle just before the test to reduce intestinal peristalsis. Table 2 summarizes the MR sequence parameters. First, conventional T1-weighted turbo spin-echo imaging with both axial and sagittal T2-weighted turbo spin-echo images and fat suppression and fat suppression exclusion was performed. Next, DW sequences were obtained from the axial plane using a single-shot echo plane image using the sensitivity coding technique. The b values corresponding to the diffusion detection gradient were 0 and 1,000 mm2/sec. T1- and T2-weighted and DW images were acquired with a cut thickness of 5 mm and a cutoff interval of 1 mm. The motion search gradient pulses were arranged in 3 orthogonal directions. Finally, PW sequences were performed on all tumors, with emphasis on the area of the solid component in the non-enhanced MRI. The images were acquired on an axial plane including the myometrium adjacent to the tumor on the optimal plane. Three-dimentional (3D), radiofrequency, and time resolved angiography stochastic trajectories (TWISTs) images (GRAPPA factor 2; Simens Healthcare, Erlangen, Germany) were used. Conventional dynamic contrast enhancement images were obtained using the TWIST technique. Gadolinium chelate (Gadovist; Bayer, Germany) was intravenously injected at a concentration of 0.1 mmol per/kg. Injection was performed with a high-pressure automatic injector (Medrad Spectris, Polkhach, Germany). The flow rate of 2 mL/sec was equivalent to 5 seconds of transient injection up to 120 mL. Then, 20 mL isotonic saline was immediately injected at the same flow rate.
- Two experienced radiologists (10 and 12 years of abdominal imaging) analyzed the masses according to the following criteria: size, bilaterality, presence of multiple locules with various signal intensities, multiseptation, presence of solid component, presence of multiple, peritoneal seeding, and lymphadenopathy. Solid portions in cystic tumors refers to the proliferation, solid portion, and thickened septum of the wall or septum of the mass, as defined by Timmerman et al. [14]. All of the solid components showed enhancement after contrast injection. On T2-weighted image (T2WI), the signal intensity in the solid component was low or intermediate compared with myometrium. Two radiologists referenced the region of interest (ROI) (average, 10.2 mm; range, 8.8–12.8 mm in the largest dimension) with reference to a T2WI. The ROI was selected for each of the 3 regions with relatively low signal intensities in the solid phase, and then the mean value was calculated as the representative value for the calculated values of the diffusivity in each ROI. In order not to include the edge of the solid portion, the ROI is mainly included in the center portion. Similar to the method of calculating the current apparent diffusion coefficient (ADC), a ROI average of 10.0 mm (range, 8.0–12.0 mm in the largest dimension) was set for the same region to derive the time course enhancement pattern of the solid component. Perfusion coefficients were determined using commercial perfusion analysis software (Syngo Tissue 4D; Siemens Medical Solutions, Erlangen, Germany). In addition, color maps were fused to T2WIs. To calculate the contrast ratio (Ktrans) and the extracellular and extracellular fraction (Ve) between the vessels and the tissues, a known Tofts model was applied. When using the Tofts model, we used the estimated mean values from various clinical perfusion imaging studies to evaluate the contrast injection function that is always applied together.
- To determine whether the distribution of BOT and stage I carcinomas differs statistically from their distribution on conventional MRI, we used Mann-Whitney and Fisher's exact tests for each criterion for continuous and categorical criteria, respectively. The mean, standard deviation, and 95% confidence interval range of each DW and PW sequence parameter were then calculated. The quadratic k coefficients were calculated to evaluate the agreement between the 2 radiologist observers (k-value, 0–0.19; poor, 0.20–0.39; fair, 0.40–0.59; moderate, 0.60–0.79; substantial, 0.80–1.00; excellent). A linear mixture model with both p-values was used to verify whether the differences between the distributions of each parameter were statistically significant. We also performed a receiver operating characteristic (ROC) curve analysis to evaluate the efficacy of conventional MRI, DW, and PW sequences in discriminating BOTs and stage I carcinoma. The area under the ROC curve (AUC) was used to determine diagnostic performance and the sensitivity and specificity were calculated from this curve analysis. Multivariate logistic regression analysis was performed to determine whether the combination of conventional MRI findings and the associated parameters such as ADC, Ktrans, and Ve improved the differentiation between BOTs and stage I carcinomas. All statistical analyses were performed using SAS 9.2 software (SAS Institute, Cary, NC, USA), and p<0.05 was considered statistically significant.
Materials and methods
- Table 3 summarizes the features of conventional MR sequence for BOTs and stage I carcinomas. The most prevalent features of stage I carcinoma were bilaterality (17 of 53 patients, 53%), peritoneal implants (9 of 14, 64%), and lymphadenopathy (4 of 8 patients, 50%). There was no statistically significant difference in size, multilocularity, the presence of loculi with various signal intensities, the presence of multiple septa, and distributions of solid components. Table 4 summarizes the 2 radiologists’ measurement results of the prevalence of the ADC, Ktrans, and Ve values for BOTs and stage I carcinomas. A case of BOTs and stage 1 carcinoma is presented (Figs. 1, 2).
- There was good consensus between the radiologists for the values (BOT, k=0.850; stage I carcinoma, k=0.890). The linear composite model of dispersion showed that the distribution of the ADC was significantly different between BOTs and stage I carcinomas (p<0.03). In this analysis, multiple lesions of a given patient were randomly selected to ensure that one lesion of a certain type was correctly included in the analysis. Therefore, it is necessary to correct the analysis by the fixation effect, and the distribution of ADC is significantly different between the BOT and the stage I carcinoma (p=0.02). Fig. 3 shows the distribution of individual ADCs. Although the mean ADCs differ significantly, the distribution of some values overlap. The mixed model analysis of variance showed that Ktrans and Ve values were significantly different between BOTs and stage I carcinomas (p<0.01). In this analysis, multiple lesions in a given patient were randomly selected. Estimates of the fixation effect indicate that the distribution of Ktrans and Ve values is significantly different between BOTs and stage I carcinomas (p=0.009 and p=0.02, respectively). The ROC of the ADC yielded AUCs of 0.58 and 0.68 for differentiation between BOTs and stage I carcinomas. The AUCs of Ktrans were 0.78 and 0.82, and those of Ve were 0.70 and 0.72 (Fig. 4). DW sequences of BOTs and stage I carcinomas showed relatively low diagnostic performance, while PW sequences showed slightly higher diagnostic performance. Fig. 5 shows the AUC of the ADC, Ktrans, and Ve parameters.
Results
- The results of this study demonstrate the diagnostic value of DW and PW sequence techniques in discriminating between BOTs and stage I carcinomas. In this study, all of the solid components on T2WIs showed low or intermediate signal intensity and could not be used as a reference for discrimination. Previous studies have suggested that bilaterality, peritoneal implants, and lymphadenopathy may be useful in the diagnosis of stage I carcinoma. It is known that BOTs have a smaller solid area, thinner septa, and lower cancer antigen-125 values when they are in the solid and septum [9]. Epithelial tumors appear to be predominantly cystic, regardless of the margin tumors and carcinomas, and contain varying degrees of solid components. As in many previous studies of conventional MRI for the differential diagnosis of BOTs and stage I carcinomas, sensitivity and specificity were also low in this study [6,12].
- Recent studies of the DW sequences related to solid components in ovarian tumors have been reported but are limited in number [5,15]; the mean ADC value of the ovarian carcinoma was 1.03×10⁻³ mm2/sec and the sensitivity and specificity were 74% and 80% for the differentiation between BOTs and stage I carcinomas, using a cutoff value of 1.15×10⁻³ mm2/sec. In the present study, the mean ADCs of BOTs and stage I carcinomas were 1.12×10⁻³ mm2/sec and 1.05×10⁻³ mm2/sec, respectively. Despite various reports that a low ADC value is more prevalent in carcinoma, wide ranges of values have been seen. Although these values do not recognize pathologic variation in cell density in BOTs and stage I carcinomas, the use of a single ADC to represent all solid components is considered a cause of this result. Nevertheless, the results of this study show significant differences in mean ADC between BOTs and stage I carcinomas. Some carcinomas may have a small necrotic or cystic area in the solid component and may appear as solid tissue with accumulation of cystic fluid intercalated between the ovarian processes. These have contributed to increasing diffusion. However, in general, carcinoma has more cellularity and a denser substrate. These differences can be explained by a further reduction of the ADC in carcinoma. Therefore, DW sequences may be helpful to differentiate between BOTs and stage I carcinomas, although the ADCs partially overlap.
- The role of PW sequences in the diagnosis of ovarian tumors is debatable. Previous studies have described the initial area under the curve of time intensity curve as the most important factor for carcinoma differentiation. Therefore, to accurately perform the discrimination decision of a mass with high accuracy, the maximum slope ratio and the initial area under the time intensity curve must be considered together. Furthermore, a type 3 time-weighted curve, which defines a steeper initial rise in signal intensity of solid tissue compared to the normal myometrial signal, appears unusual in carcinoma [16-18]. In contrast, in this study, quantitative analysis of PW sequences was conducted to differentiate BOTs and stage I carcinomas. Recent studies have shown that the presence of vulnerable neovasculature, initially incompletely formed, acts as an optimal mediator, as the malignant tumor progresses more rapidly than the BOTs or benign tumors, and that enhancement and detachment may occur [19-23]. In carcinoma, blood vessel formation occurs due to the synthesis and secretion of angiogenic factors. The number of blood vessels is increased and the integrity of the blood vessel wall is low, so that the permeability of the tumor wall increases and the interstitial space is increased. Because of these differences, carcinomas with angiogenic neovasculature have prominent enhancement [24-26]. Thus, quantitative physiological parameters such as perfusion volume, blood volume, capillary permeability, and fraction volume contribute to this enhancement. In this study, contrast enhancement characteristics were different between BOTs and stage I carcinomas, and quantitative perfusion imaging parameters such as Ktrans and Ve were helpful in differentiating between BOTs and stage I carcinomas. In brain, prostate, and breast tumors, diagnostic information from multiple parameters, including DW and PW sequences, is obtained and provides better accuracy than is possible with the use of a single parameter [21-26].
- In this study, the ADC has low statistical significance in the logistic regression model analysis and the AUCis only 0.71. Further, ADC is less effective than Ktrans and Ve in differentiating between BOTs and stage I carcinomas, but diagnostic accuracy when combined with Ktrans and Ve increases sensitivity with a low false positive rate. Prospective study of the association of DW and PW sequences is needed to evaluate the clinical usefulness of this approach to discriminate between BOTs and stage I carcinomas.
- This study has some limitations. First, histopathologically proven cases involving only solid components are considered. This might have introduced selection and verification bias. In addition, there were few cases of BOTs and it was difficult to perform precise analysis to distinguish them from stage I carcinomas. Second, the current implementation plan for MRI has limitations with respect to planar resolution and image sharpness. These can affect the computation of quantitative parameters of the DW and PW sequences. In cases where the amount of solid content is small, the accuracy of DW and PW sequences may decrease due to the increase in motion artifacts. However, recent techniques such as multi-shot DW and volume isotropic turbo spin-echo acquisition segmented 3D sequences have enabled improved quantification of tissue components and dynamic signal time course features. Third, only 57 patients underwent imaging with both DW and PW sequences. Larger populations are needed to verify whether there is a meaningful difference between conventional MRI with both DW and PW sequences compared with the respective ones. In addition, in this study, the diagnosis could not be corrected for the same tumor misdiagnosed on DW and PW sequences. In some cases, the PW sequence was useful for diagnosis and the DW sequence was irrelevant, and in other cases, the opposite occurred. Finally, these techniques require external validation, such as establishing a firm cutoff value for the standardized ADC, Ktrans, and Ve for universal use. Because the accuracy of this study was based on thresholds set from the same population, performance may have been overestimated. Improvement of DW and PW techniques enables evaluation of the overall solid content, thereby reducing the possibility of overlapping parameters. Therefore, the sensitivity and specificity for predicting the solidity of a solid component can be improved.
- In conclusion, the parameters of DW and PW sequences were significantly different between BOTs and stage I carcinomas. Although the use of a quantitative DW sequence alone is not effective for discrimination, combination of the ADC, Ktrans, and Ve can improve the differentiation compared to the use of the ADC alone.
Discussion
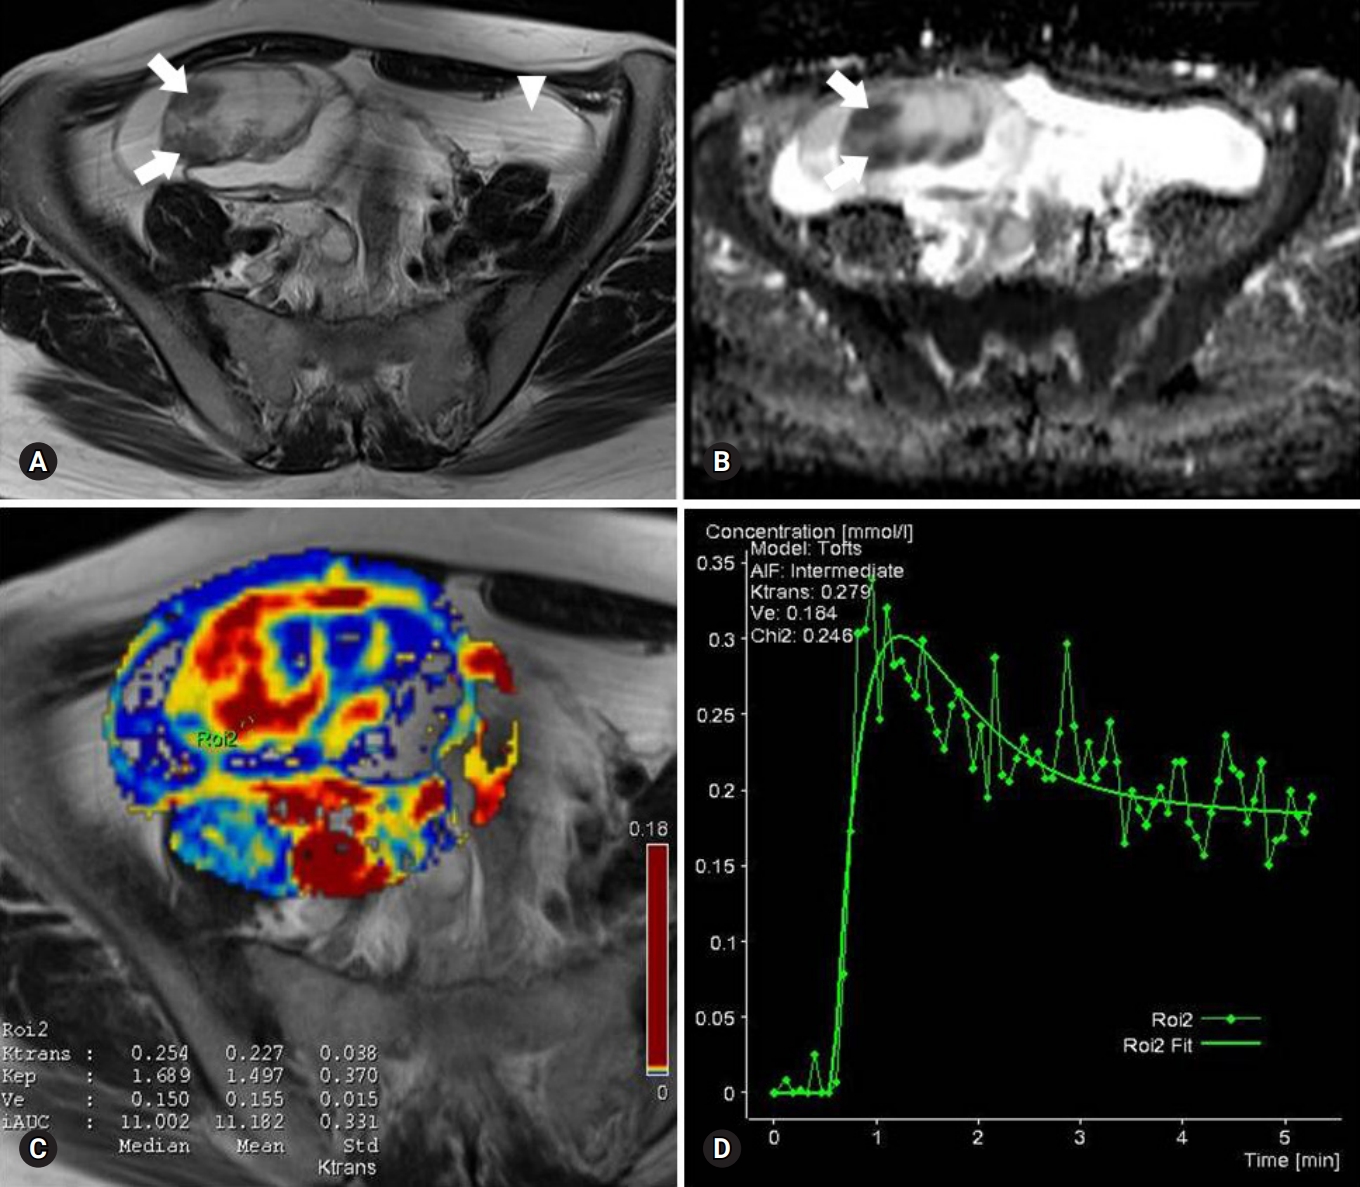
Fig. 1.Images of a serous cystadenoma borderline tumor in a 46-year-old woman. (A) T2-weighted fast spin-echo axial MR image shows a right ovarian tumor with cystic and solid components as solid portions (arrows) with low signal intensity. Ascites (arrowhead) is shown. (B) ADC map obtained at b=1,000 mm2/sec shows restricted diffusion in the solid portions (arrows, measured mean ADC map=1.12×10⁻³ mm2/sec). (C) Ktrans and Ve map color overlain on a T2-weighted MR image shows increased Ktrans and Ve values throughout the solid portions (measured Ktrans and Ve of the ROI2=0.254/min and 0.150). (D) Relative enhancement time fitting curve of the solid component of the borderline tumor is shown. MR, magnetic resonance; ADC, apparent diffusion coefficient; ROI, region of interest.

Fig. 2.Images of a stage I serous adenocarcinoma in a 42-year-old woman. (A) T2-weighted fast spin-echo axial MR image shows a right ovarian tumor with predominant solid portions (arrows) with low to intermediate signal intensity. (B) ADC map obtained at b=1,000 mm2/sec shows restricted diffusion in the solid portions (arrows, measured mean ADC map=1.07×10⁻³ mm2/sec). (C) Ktrans and Ve map color overlain on a T2-weighted MR image shows increased Ktrans and Ve values over the area corresponding to the carcinoma (measured Ktrans and Ve of the ROI1=0.323/min and 0.332). (D) Relative enhancement time fitting curve of the solid component of the carcinoma is shown. MR, magnetic resonance; ADC, apparent diffusion coefficient; ROI, region of interest.
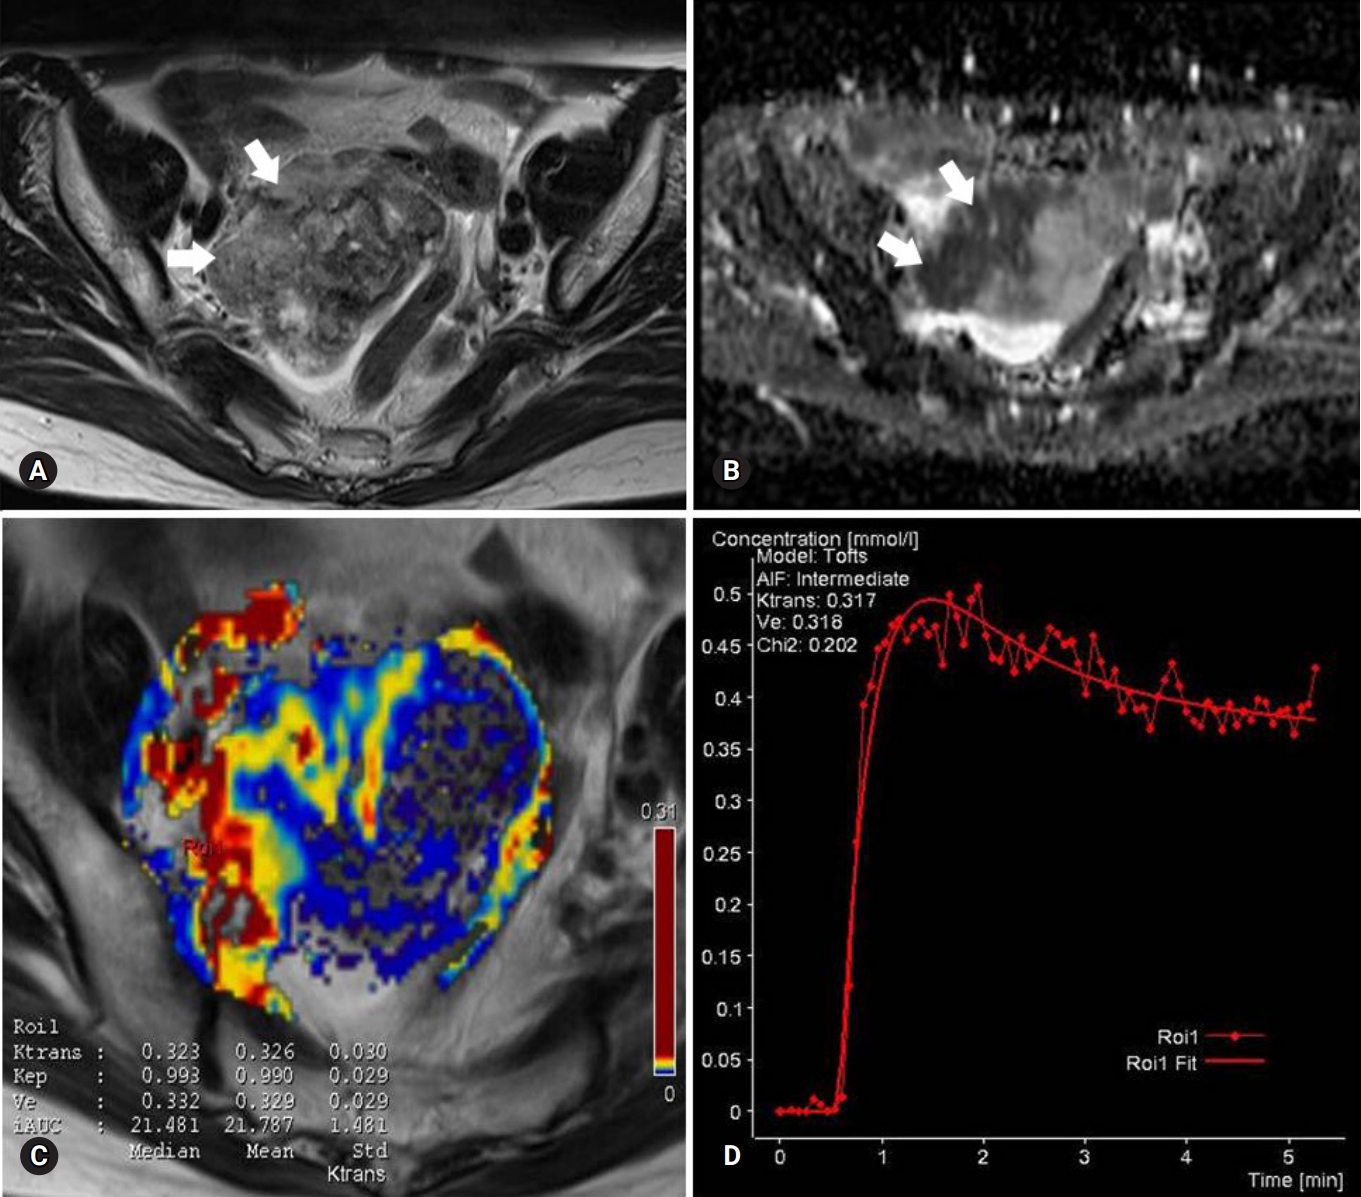
Fig. 3.Box and whisker plot of ADC values for borderline tumors and stage I carcinomas. Data box=individual ADC value, horizontal lines=average and associated 95% confidence intervals. ADC, apparent diffusion coefficient.
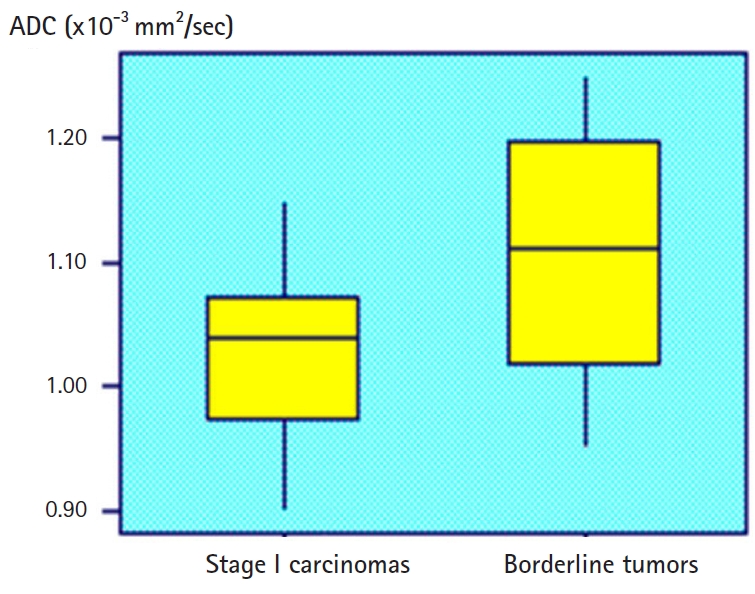
Fig. 4.ROC curves of ADC, Ve, and Ktrans parameters in the differentiation of borderline tumors (A) and stage I carcinomas (B). 1=ADC, 2=Ve, and 3=Ktrans. ROC, receiver operating characteristic; ADC, apparent diffusion coefficient.
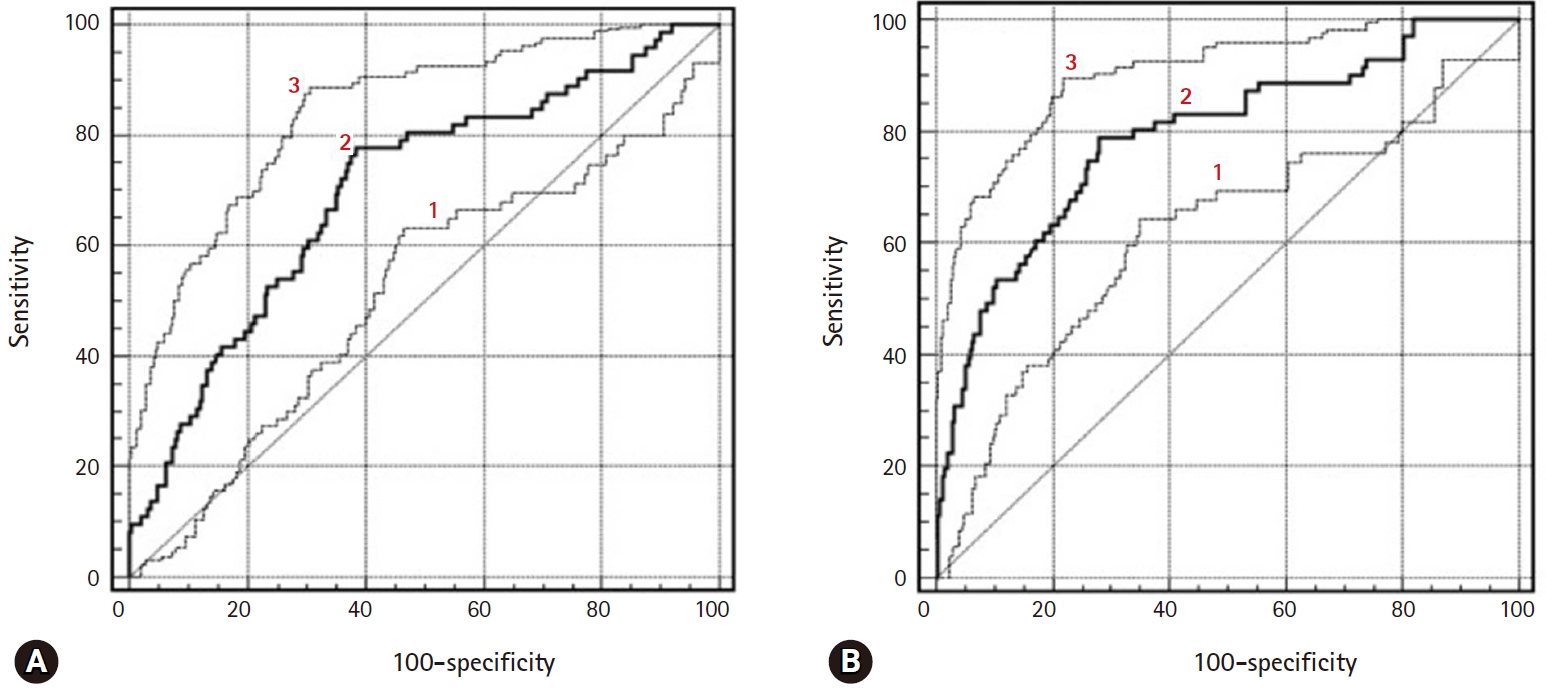
Fig. 5.ROC curves of diagnostic performance for PW sequence, DW sequence, and combining PW and DW sequences to a conventional sequence in the differentiation of borderline tumors and stage I carcinomas. 1=DW sequence only, 2=PW sequence only, and 3=combined PW+DW sequences. ROC, receiver operating characteristic; PW, perfusion-weighted; DW, diffusion-weighted.
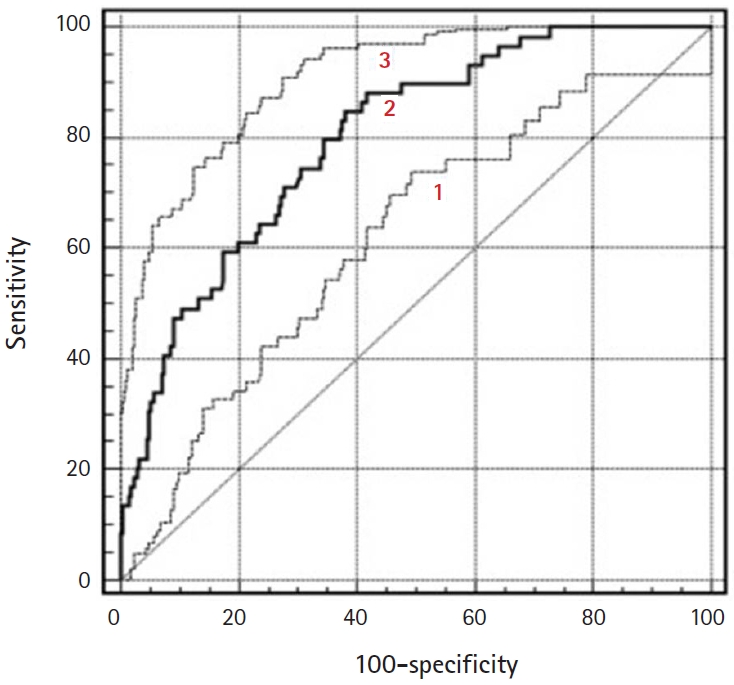
Table 1.Patient population and index test results
| Conv MR (n=70) | |||||
|---|---|---|---|---|---|
| Conv MR+DW (n=63) | Conv MR+PW (n=61) | Conv MR+DW+PW (n=57) | |||
| BOT | Stage I carcinoma | BOT | Stage I carcinoma | BOT | Stage I carcinoma |
| n=33 | n=30 | n=33 | n=28 | n=32 | n=25 |
Table 2.Magnetic resonance imaging protocols
Table 3.Conventional MR sequence characteristics of borderline tumors and stage I carcinomas
| Characteristic | No. of findings | Borderline tumors (n=38) | Stage I carcinomas (n=32) | p-value |
|---|---|---|---|---|
| Mean patient age (yr) | 70 | 40.8±14.2 | 43.2±13.2 | 0.58a) |
| Mean lesion size (cm) | 70 | 12.5±4.4 | 14.1±5.2 | 0.42a) |
| Bilaterality | 70 | 16 (6/38) | 53 (17/32) | 0.005b) |
| Multilocularity | 48 | 59 (13/22) | 69 (18/26) | 0.01b) |
| Loculi with different signal intensity | 25 | 50 (5/10) | 47 (7/15) | 0.38b) |
| Multiseptation | 50 | 71 (20/28) | 64 (14/22) | 0.08b) |
| Solid components | 70 | - | - | |
| Vegetation | 32 | 58 (7/12) | 65 (13/20) | 0.08a) |
| Solid portion | 20 | 57 (4/7) | 62 (8/13) | 0.10a) |
| Thickened septa | 18 | 62 (5/8) | 70 (7/10) | 0.08a) |
| Ascites | 31 | 40 (4/10) | 43 (9/21) | 0.07a) |
| Peritoneal implants | 20 | 33 (2/6) | 64 (9/14) | 0.03b) |
| Lymphadenopathy | 8 | 0 | 50 (4/8) | 0.001b) |
| Signal intensity of solid component on T2 | 70 | - | - | |
| Low signal intensity | 25 | 43 (6/14) | 45 (5/11) | 0.10b) |
| Intermediate signal intensity | 45 | 54 (15/28) | 64 (11/17) | 0.09b) |
Table 4.Results of the comparison of ADC, Ktrans, and Ve values for borderline tumors and stage I carcinomas between 2 radiologists
- 1. Aref M, Handbury JD, Xiuquan Ji J, Aref S, Wiener EC. Spatial and temporal resolution effects on dynamic contrast-enhanced magnetic resonance mammography. Magn Reson Imaging 2007;25:14–34.ArticlePubMed
- 2. Cuenod CA, Fournier L, Balvay D, Guinebretière JM. Tumor angiogenesis: pathophysiology and implications for contrast-enhanced MRI and CT assessment. Abdom Imaging 2006;31:188–93.ArticlePubMedPDF
- 3. deSouza NM, O'Neill R, McIndoe GA, Dina R, Soutter WP. Borderline tumors of the ovary: CT and MRI features and tumor markers in differentiation from stage I disease. AJR Am J Roentgenol 2005;184:999–1003.ArticlePubMed
- 4. Emoto M, Iwasaki H, Mimura K, Kawarabayashi T, Kikuchi M. Differences in the angiogenesis of benign and malignant ovarian tumors, demonstrated by analyses of color Doppler ultrasound, immunohistochemistry, and microvessel density. Cancer 1997;80:899–907.ArticlePubMed
- 5. Fujii S, Kakite S, Nishihara K, Kanasaki Y, Harada T, Kigawa J, et al. Diagnostic accuracy of diffusion-weighted imaging in differentiating benign from malignant ovarian lesions. J Magn Reson Imaging 2008;28:1149–56.ArticlePubMed
- 6. Hricak H, Chen M, Coakley FV, Kinkel K, Yu KK, Sica G, et al. Complex adnexal masses: detection and characterization with MR imaging--multivariate analysis. Radiology 2000;214:39–46.ArticlePubMed
- 7. Kozlowski P, Chang SD, Jones EC, Berean KW, Chen H, Goldenberg SL. Combined diffusion-weighted and dynamic contrast-enhanced MRI for prostate cancer diagnosis--correlation with biopsy and histopathology. J Magn Reson Imaging 2006;24:108–13.ArticlePubMed
- 8. Landis JR, Koch GG. An application of hierarchical kappa-type statistics in the assessment of majority agreement among multiple observers. Biometrics 1977;33:363–74.ArticlePubMed
- 9. Lee EJ, Kim SH, Kim YH, Lee HJ. Is CA-125 an additional help to radiologic findings for differentiation borderline ovarian tumor from stage I carcinoma? Acta Radiol 2011;52:458–62.ArticlePubMed
- 10. Metz CE, Shen JH. Gains in accuracy from replicated readings of diagnostic images: prediction and assessment in terms of ROC analysis. Med Decis Making 1992;12:60–75.ArticlePubMed
- 11. Metz CE, Pan X. "Proper" binormal ROC curves: theory and maximum-likelihood estimation. J Math Psychol 1999;43:1–33.ArticlePubMed
- 12. Moore RG, Bast RC Jr. How do you distinguish a malignant pelvic mass from a benign pelvic mass? Imaging, biomarkers, or none of the above. J Clin Oncol 2007;25:4159–61.ArticlePubMed
- 13. Nakayama T, Yoshimitsu K, Irie H, Aibe H, Tajima T, Nishie A, et al. Diffusion-weighted echo-planar MR imaging and ADC mapping in the differential diagnosis of ovarian cystic masses: usefulness of detecting keratinoid substances in mature cystic teratomas. J Magn Reson Imaging 2005;22:271–8.ArticlePubMed
- 14. Timmerman D, Valentin L, Bourne TH, Collins WP, Verrelst H, Vergote I, et al. Terms, definitions and measurements to describe the sonographic features of adnexal tumors: a consensus opinion from the International Ovarian Tumor Analysis (IOTA) Group. Ultrasound Obstet Gynecol 2000;16:500–5.ArticlePubMed
- 15. Sohaib SA, Sahdev A, Van Trappen P, Jacobs IJ, Reznek RH. Characterization of adnexal mass lesions on MR imaging. AJR Am J Roentgenol 2003;180:1297–304.ArticlePubMed
- 16. Thomassin-Naggara I, Daraï E, Cuenod CA, Rouzier R, Callard P, Bazot M. Dynamic contrast-enhanced magnetic resonance imaging: a useful tool for characterizing ovarian epithelial tumors. J Magn Reson Imaging 2008;28:111–20.ArticlePubMed
- 17. Thomassin-Naggara I, Bazot M, Daraï E, Callard P, Thomassin J, Cuenod CA. Epithelial ovarian tumors: value of dynamic contrast-enhanced MR imaging and correlation with tumor angiogenesis. Radiology 2008;248:148–59.ArticlePubMed
- 18. Thomassin-Naggara I, Daraï E, Cuenod CA, Fournier L, Toussaint I, Marsault C, et al. Contribution of diffusion-weighted MR imaging for predicting benignity of complex adnexal masses. Eur Radiol 2009;19:1544–52.ArticlePubMedPDF
- 19. Nishida N, Yano H, Komai K, Nishida T, Kamura T, Kojiro M. Vascular endothelial growth factor C and vascular endothelial growth factor receptor 2 are related closely to the prognosis of patients with ovarian carcinoma. Cancer 2004;101:1364–74.ArticlePubMed
- 20. Orre M, Lotfi-Miri M, Mamers P, Rogers PA. Increased microvessel density in mucinous compared with malignant serous and benign tumours of the ovary. Br J Cancer 1998;77:2204–9.ArticlePubMedPMCPDF
- 21. Oto A, Kayhan A, Jiang Y, Tretiakova M, Yang C, Antic T, et al. Prostate cancer: differentiation of central gland cancer from benign prostatic hyperplasia by using diffusion-weighted and dynamic contrast-enhanced MR imaging. Radiology 2010;257:715–23.ArticlePubMed
- 22. Padhani AR, Dzik-Jurasz A. Perfusion MR imaging of extracranial tumor angiogenesis. Top Magn Reson Imaging 2004;15:41–57.ArticlePubMed
- 23. Song T, Laine AF, Chen Q, Rusinek H, Bokacheva L, Lim RP, et al. Optimal k-space sampling for dynamic contrast-enhanced MRI with an application to MR renography. Magn Reson Med 2009;61:1242–8.ArticlePubMedPMC
- 24. Takemori M, Nishimura R, Hasegawa K. Clinical evaluation of MRI in the diagnosis of borderline ovarian tumors. Acta Obstet Gynecol Scand 2002;81:157–61.ArticlePubMed
- 25. Takeuchi M, Matsuzaki K, Nishitani H. Diffusion-weighted magnetic resonance imaging of ovarian tumors: differentiation of benign and malignant solid components of ovarian masses. J Comput Assist Tomogr 2010;34:173–6.ArticlePubMed
- 26. Yankeelov TE, Lepage M, Chakravarthy A, Broome EE, Niermann KJ, Kelley MC, et al. Integration of quantitative DCE-MRI and ADC mapping to monitor treatment response in human breast cancer: initial results. Magn Reson Imaging 2007;25:1–13.ArticlePubMed
References
Figure & Data
References
Citations
Citations to this article as recorded by 
- Advances in fertility preserving surgery for borderline ovarian tumors
Mingdan Wang, Kuiran Liu
European Journal of Obstetrics & Gynecology and Reproductive Biology.2022; 270: 206. CrossRef - Recurrence characteristics and clinicopathological results of borderline ovarian tumors
Lina Niu, Huihui Tian, Yongjun Xu, Jieqiong Cao, Xu Zhang, Junli Zhang, Jiajia Hou, Weiqin Lv, Junxia Wang, Li Xin, XuFeng Dong, Tao Xu, Yuan Nan, Hua Wei, Xinting Chai, Na Li, Yan Ni, Yun Shang, Lizhen Zhang, Ye Zhao
BMC Women's Health.2021;[Epub] CrossRef - Erratum to “Assessment of solid components of borderline ovarian tumor and stage I carcinoma: added value of combined diffusion- and perfusion-weighted magnetic resonance imaging”
See Hyung Kim
Yeungnam University Journal of Medicine.2020; 37(2): 147. CrossRef
 PubReader
 ePub Link
 Cite
Cite